Sonterra Housing Market
Increase/Decrease activity is compared to the month of September
In case of no data for this period, the latest 30-day average is used. Subscribe to Market Insights
What these Sonterra numbers cover
These figures include homes listed for sale in the Sonterra neighborhoods around the Club at Sonterra, at the south end of Stone Oak. Many sit on the golf course. Sonterra is made up of several separate subdivisions, so we track each one by name. The numbers update automatically from LERA MLS, formerly the San Antonio Board of REALTORS® MLS.
Sonterra homes are also counted in our Stone Oak numbers, since both share ZIP code 78258.
How to read them
Average listing price is not what homes sell for. It's what sellers are asking, and a few high-priced homes can pull the average up. Sold prices tell you more.
Inventory changes daily. More homes for sale means more competition for sellers and more choice for buyers.
Your home isn't the average. Condition, updates, lot, and street all move the price. For a number specific to your home, ask Michael Marelli for a market analysis at 210-393-6616.
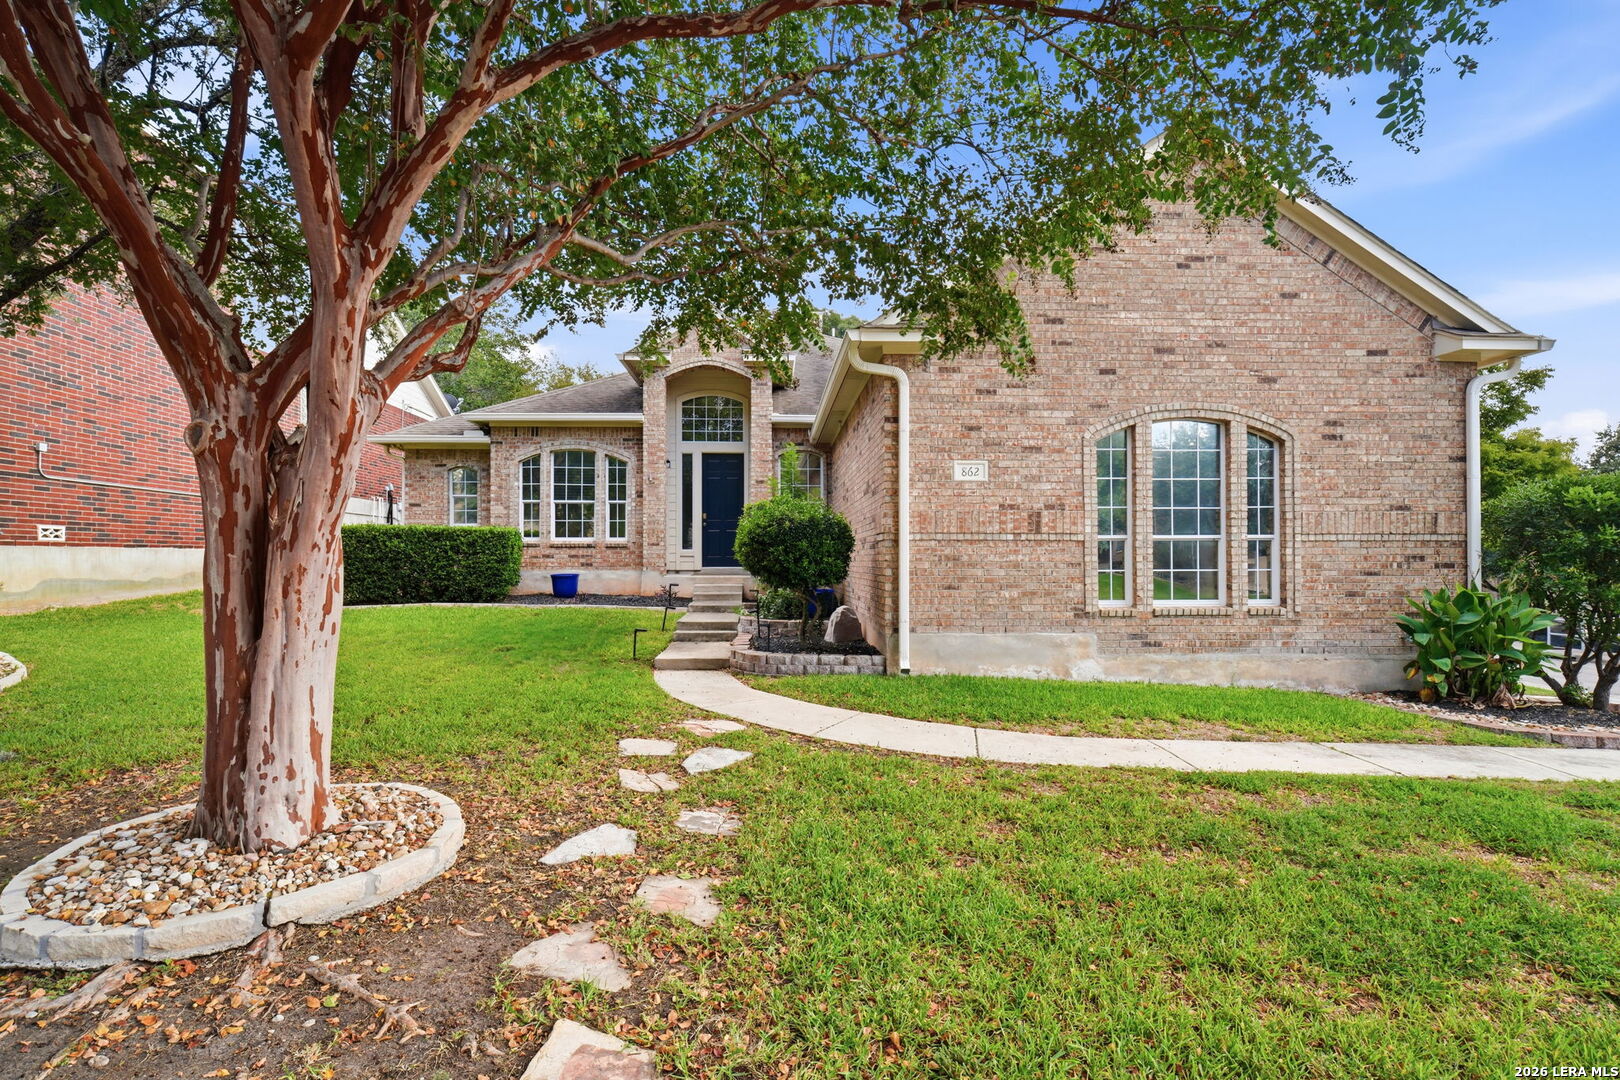
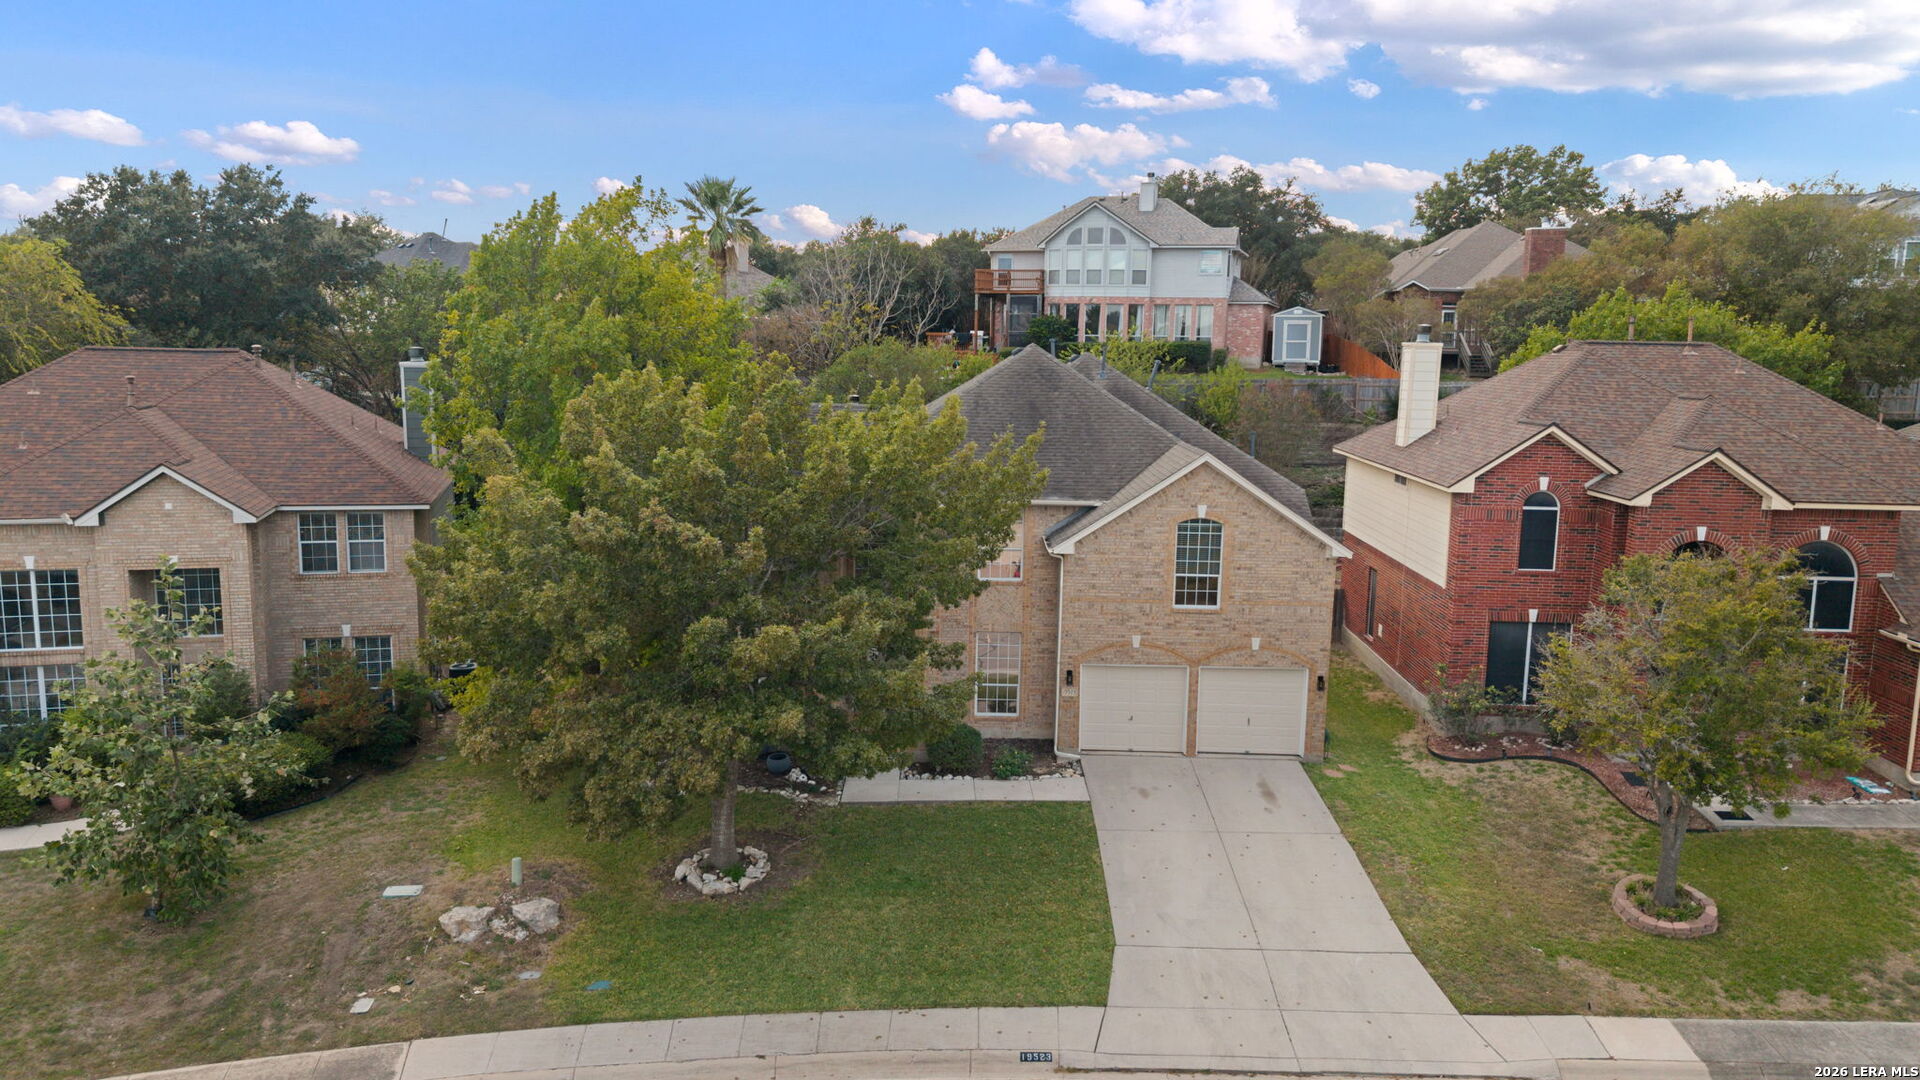
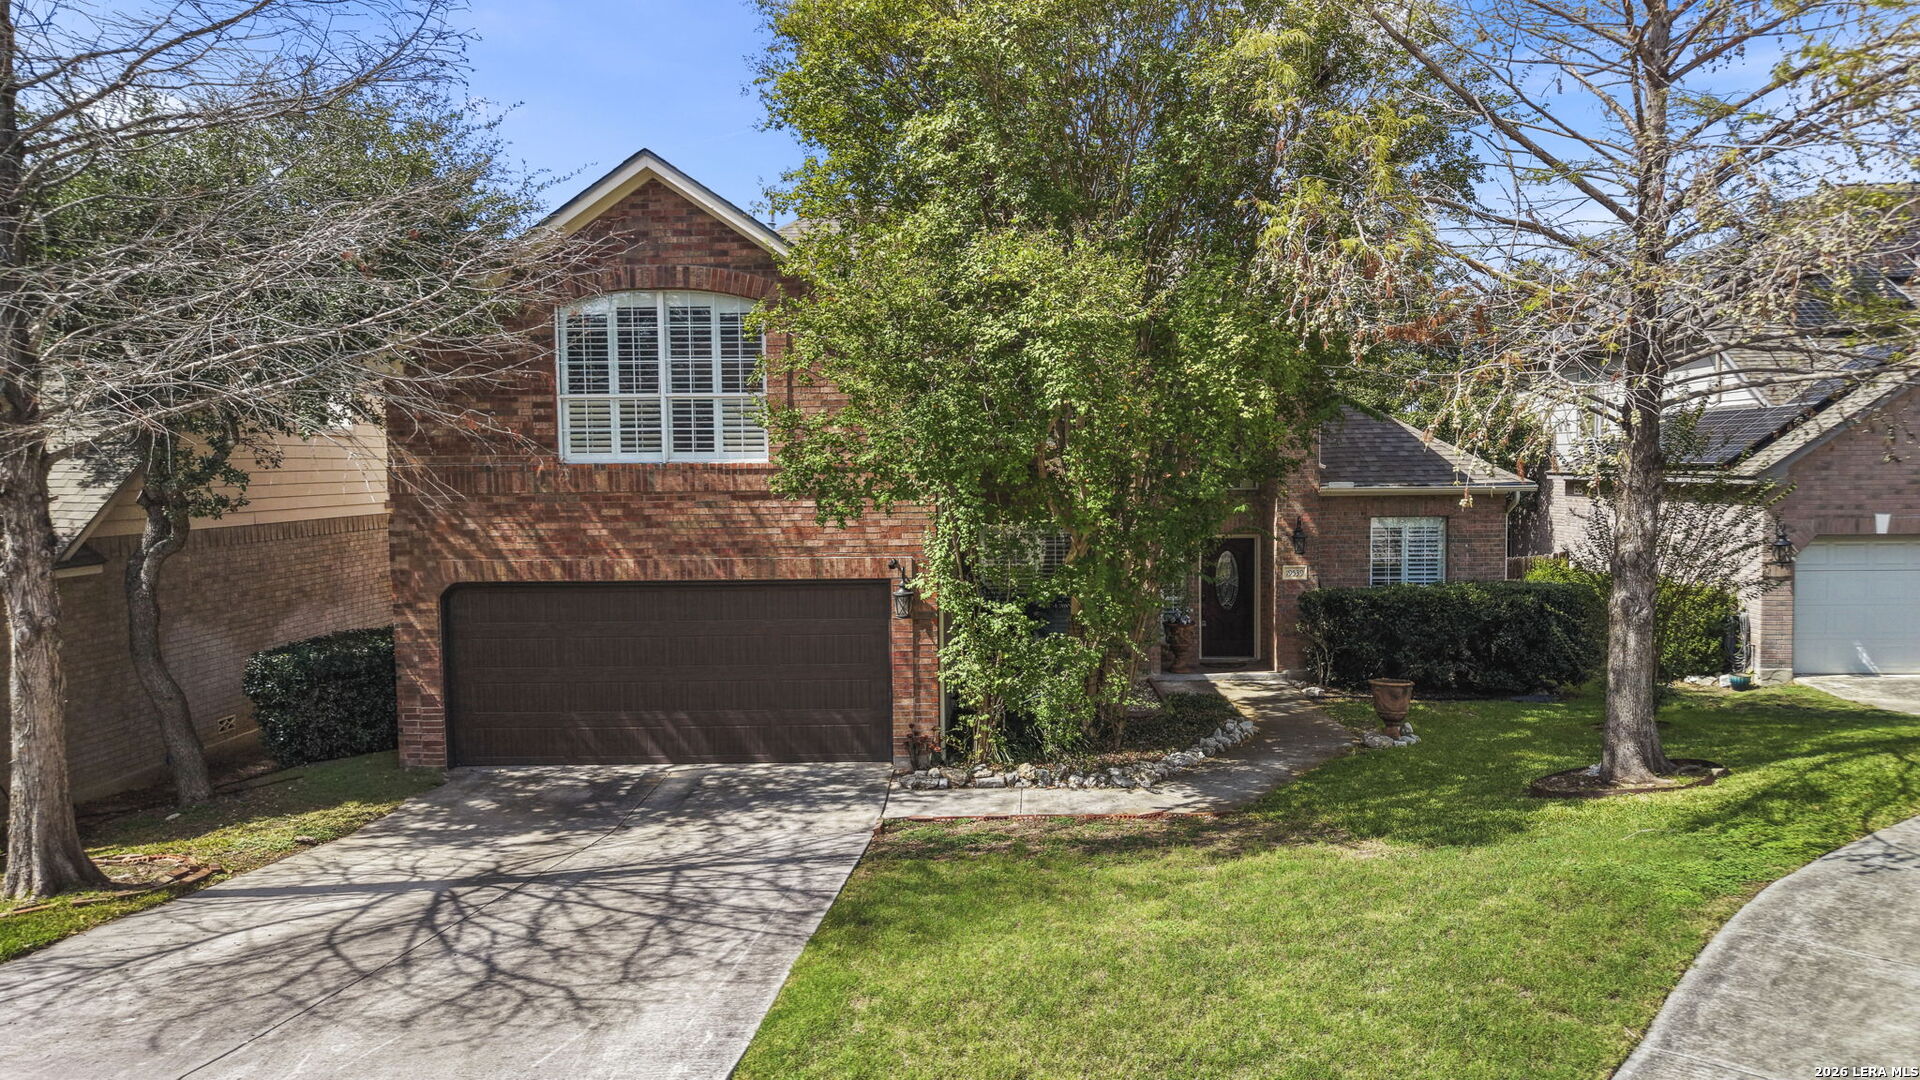
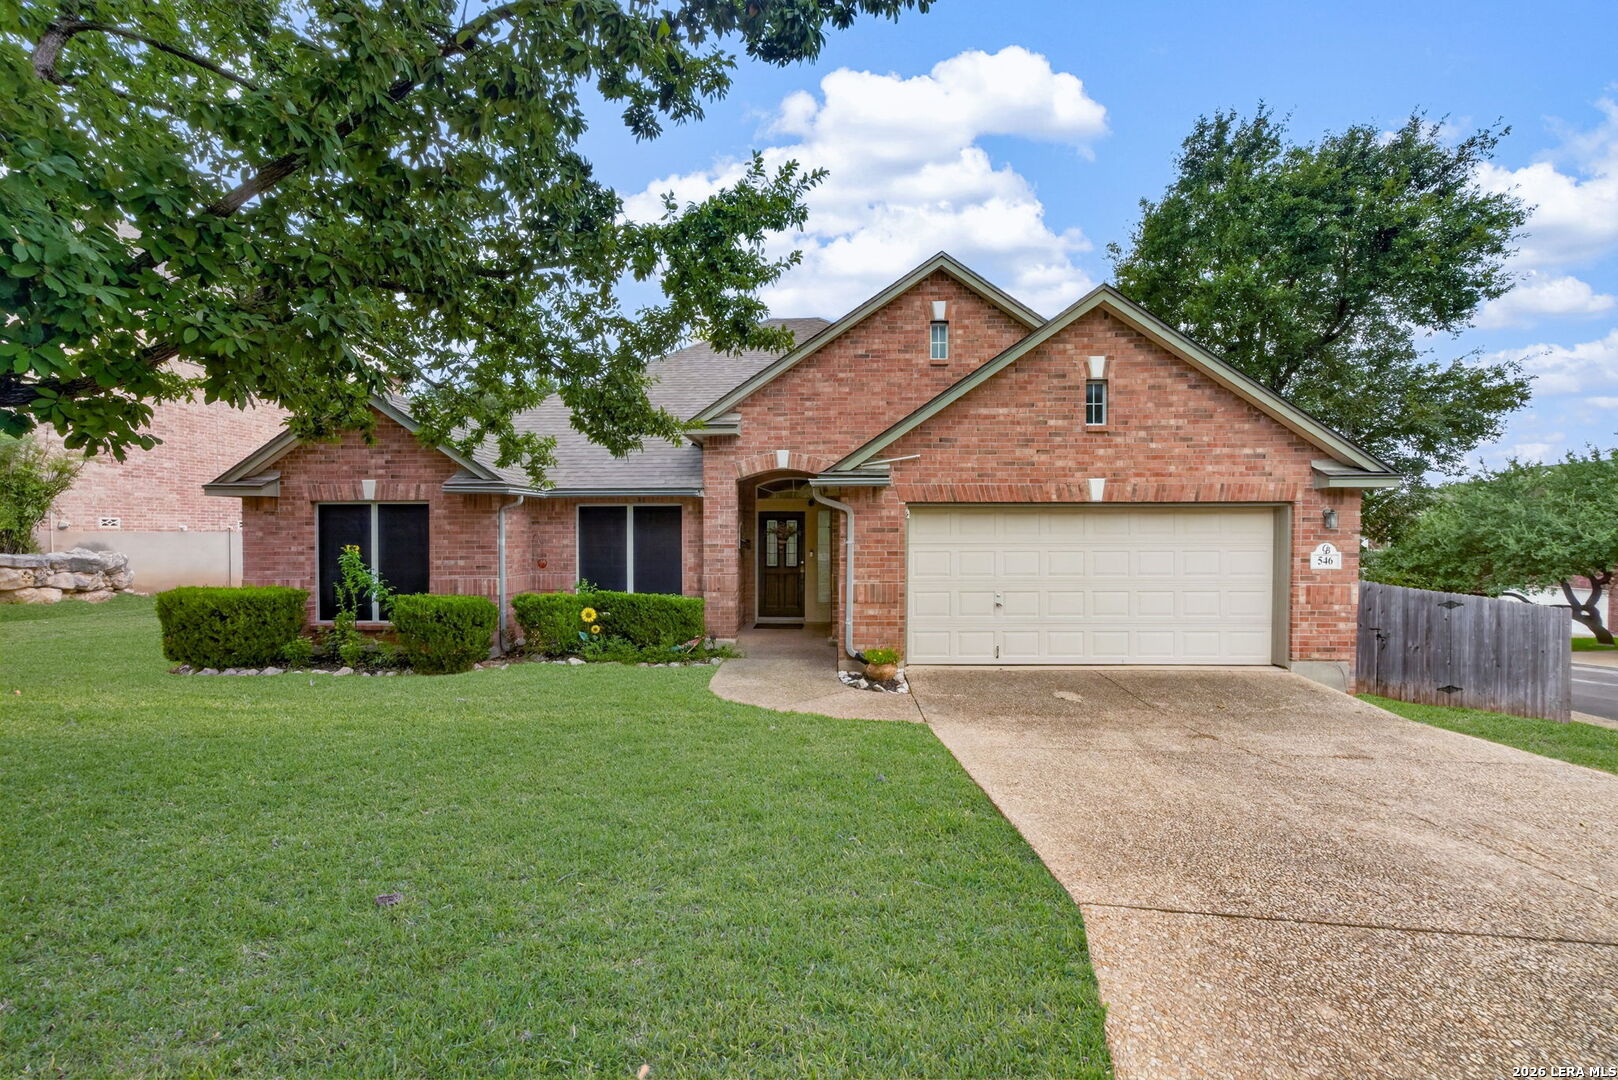
Active Properties in Sonterra
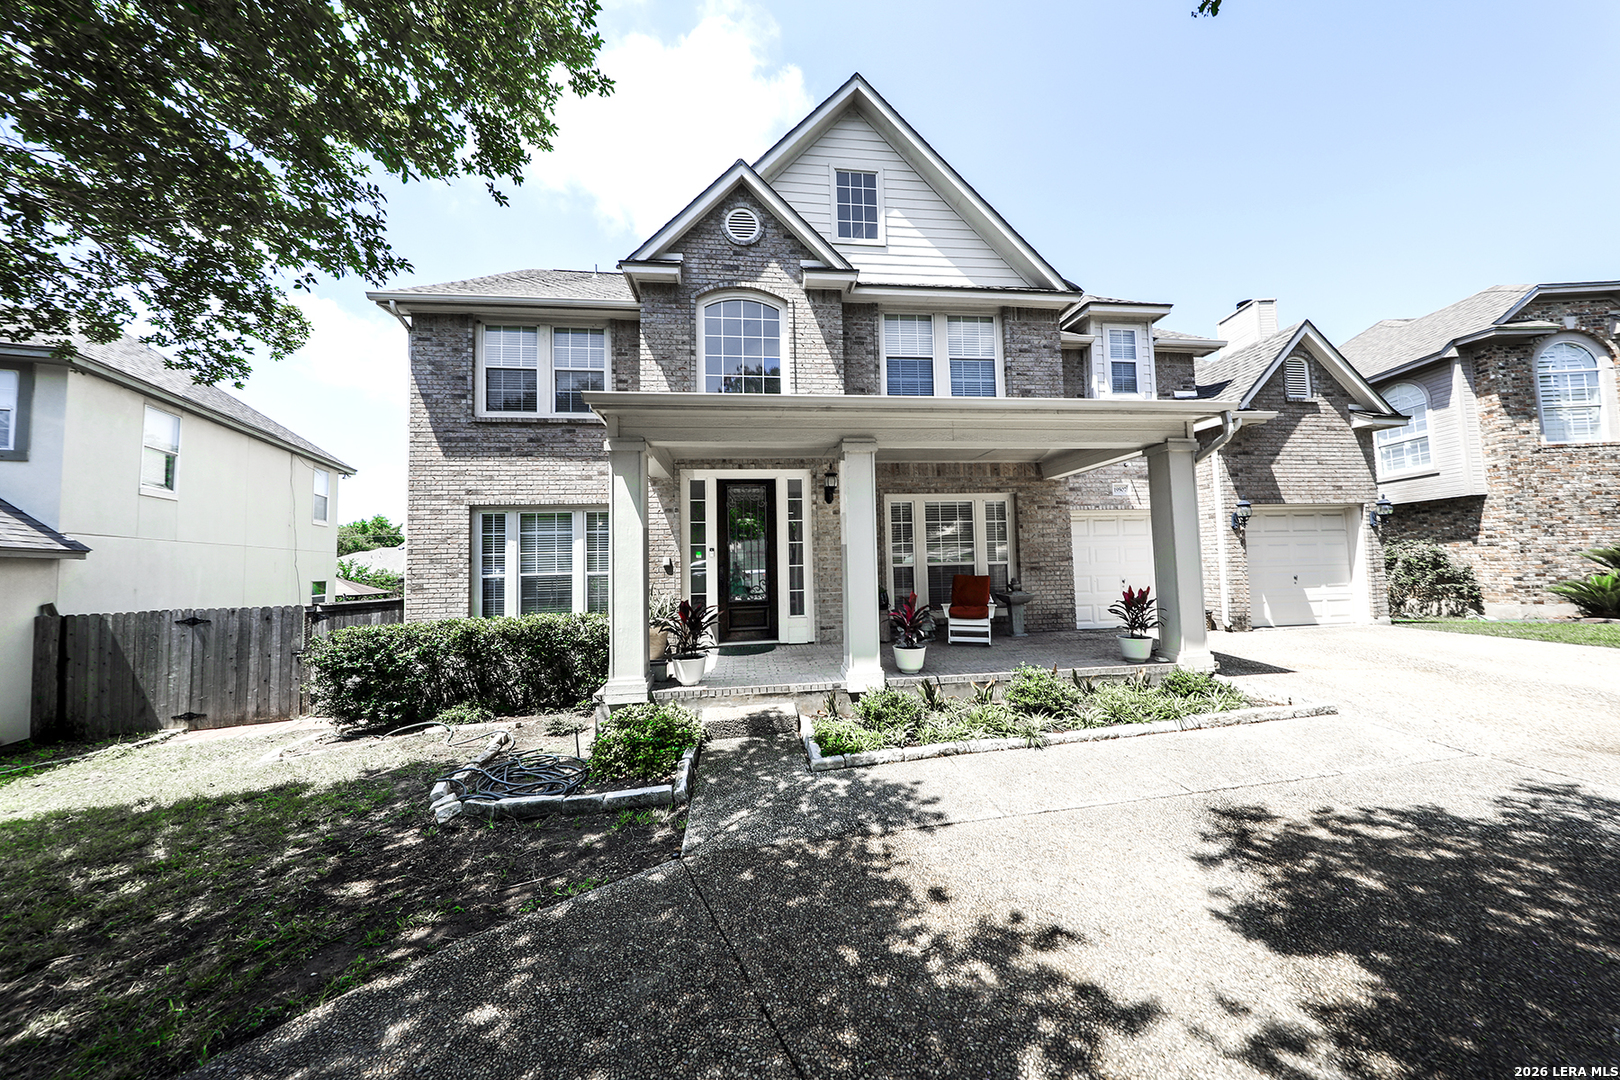
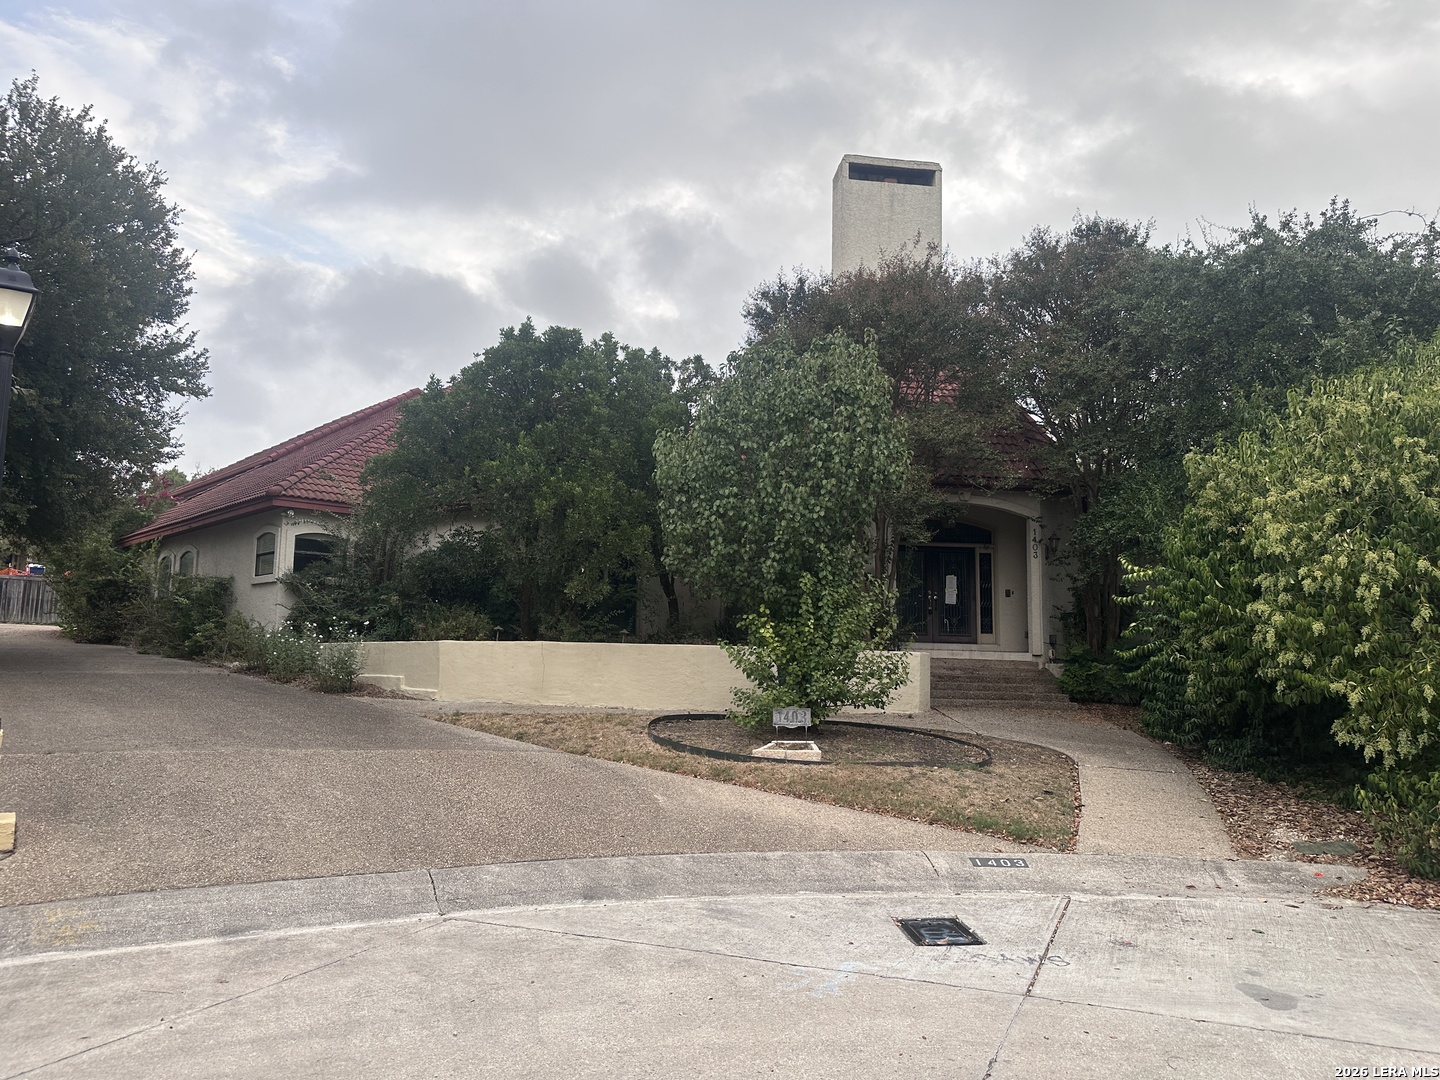
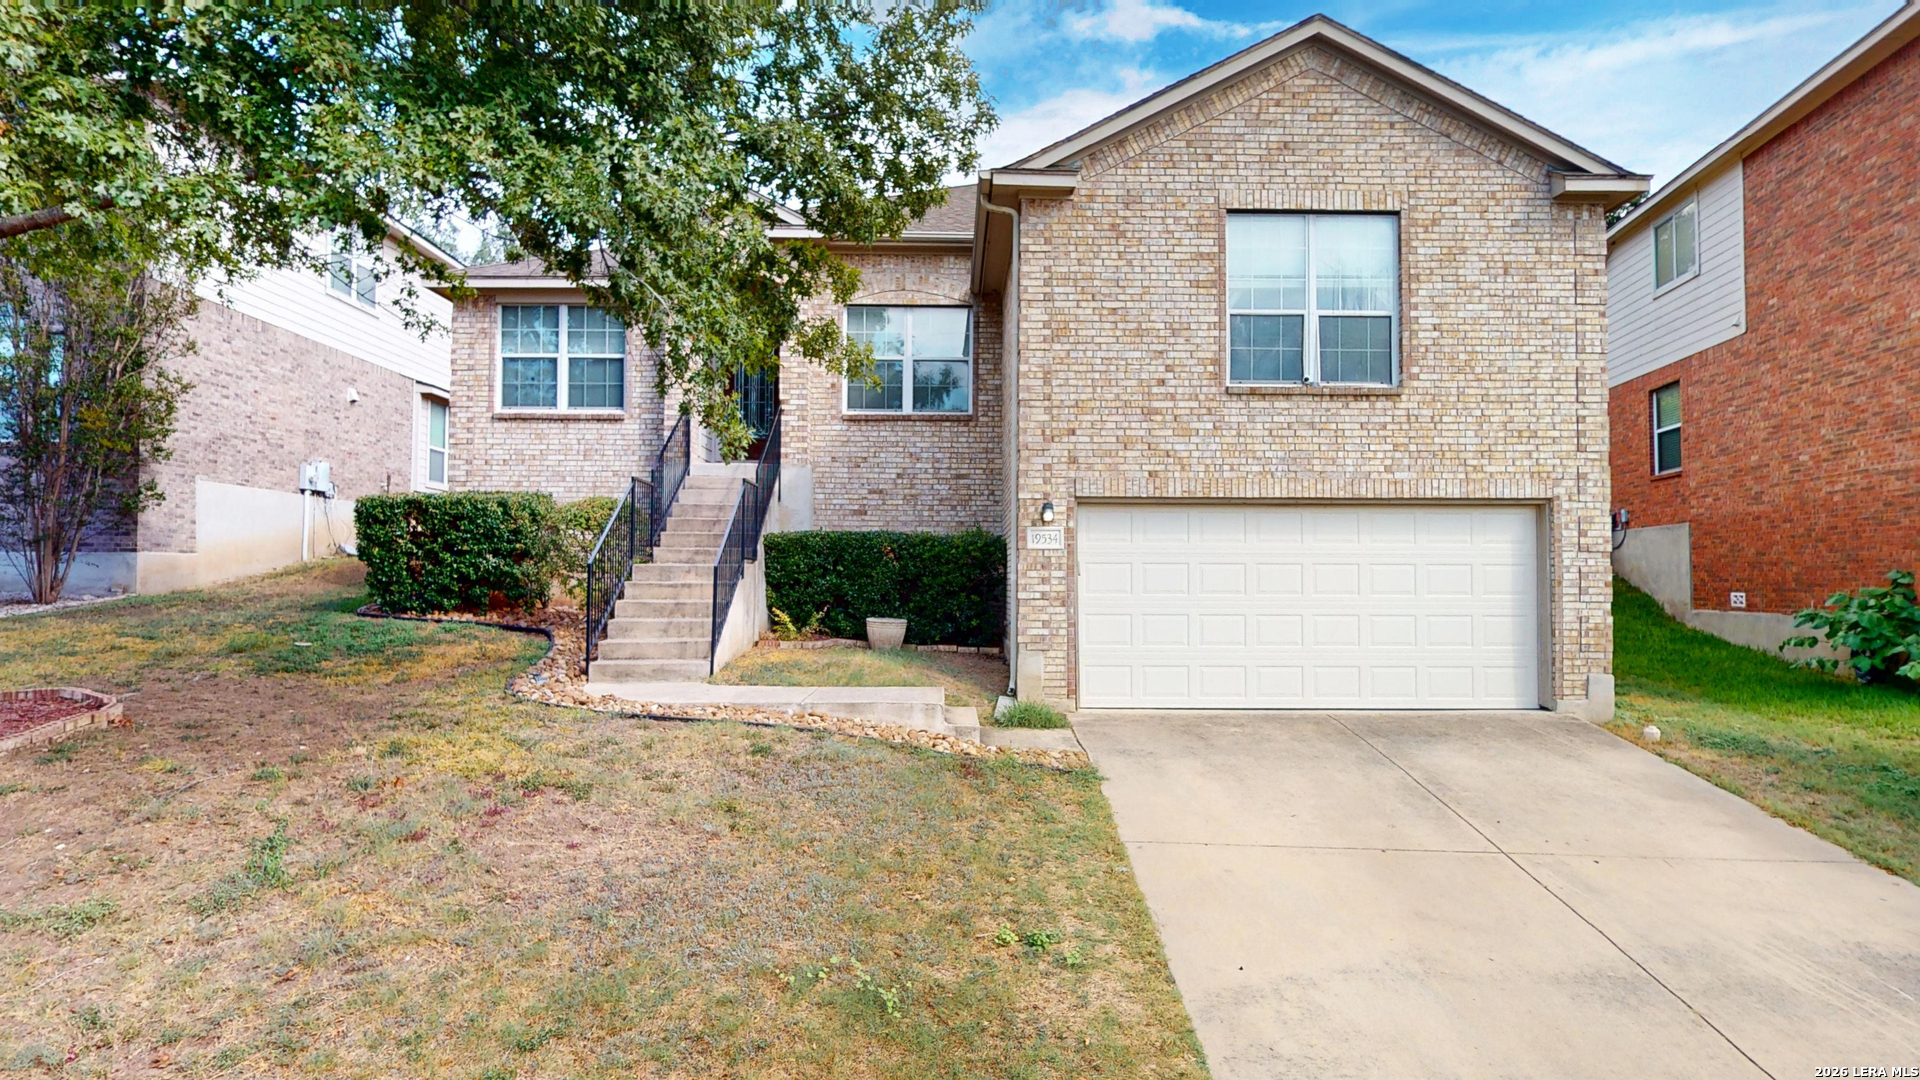
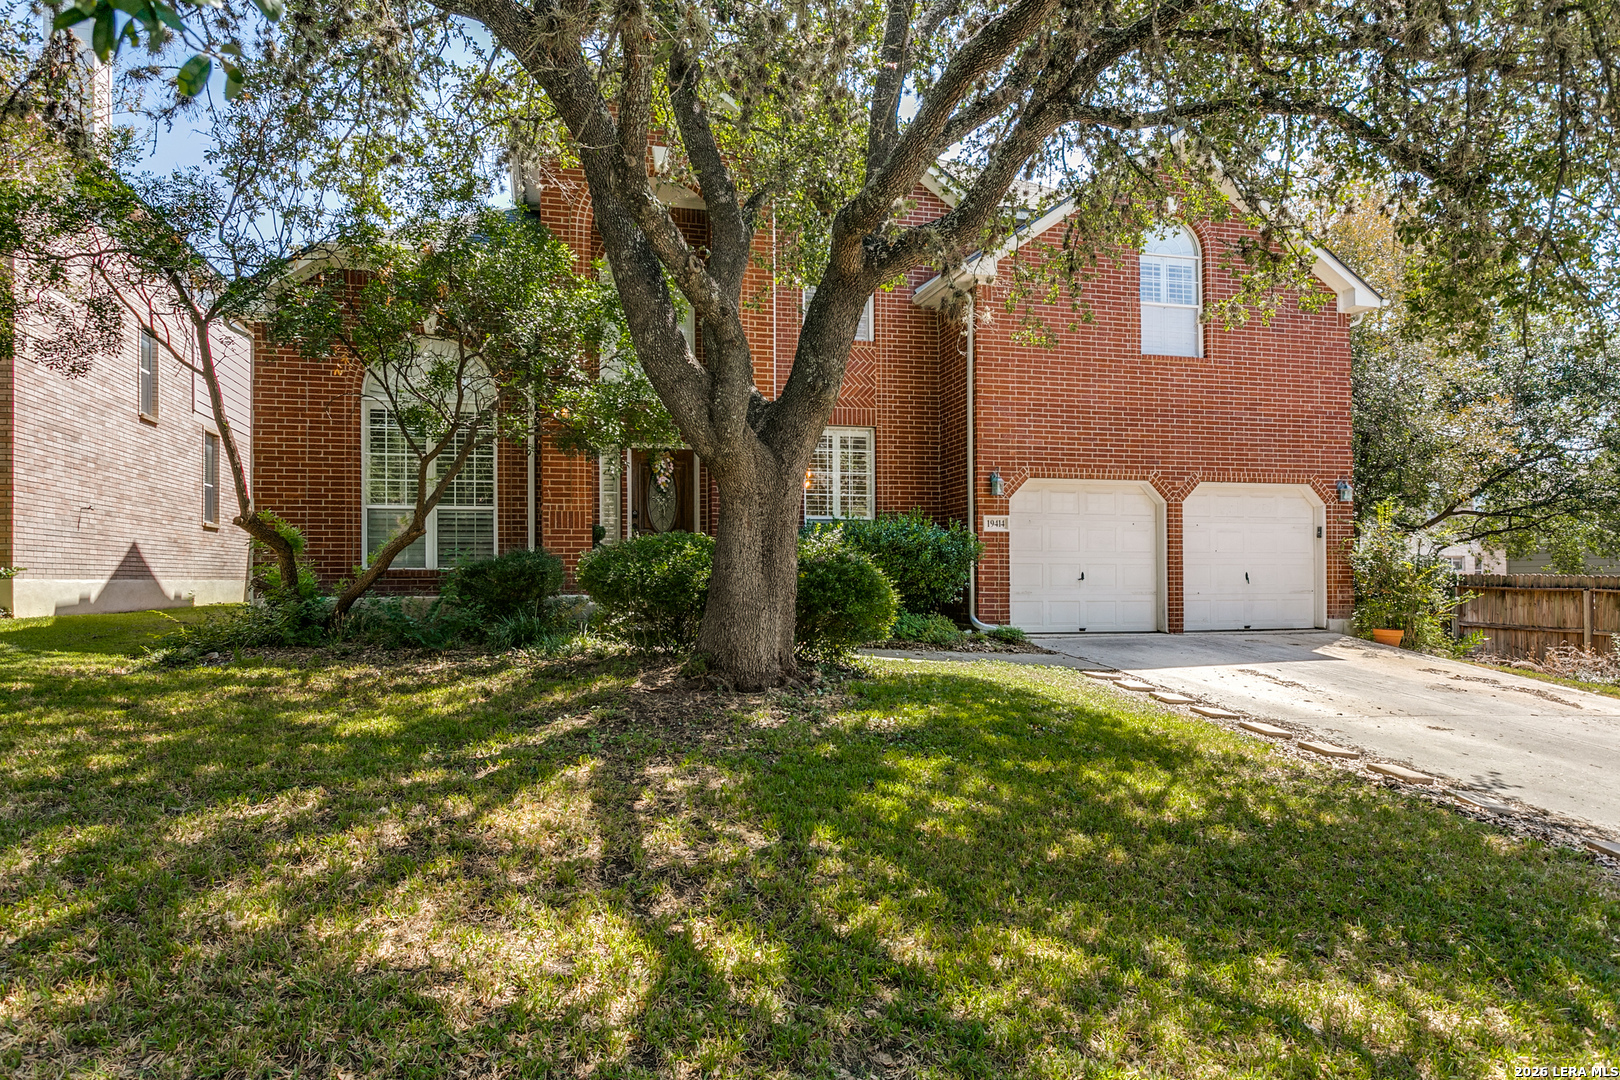
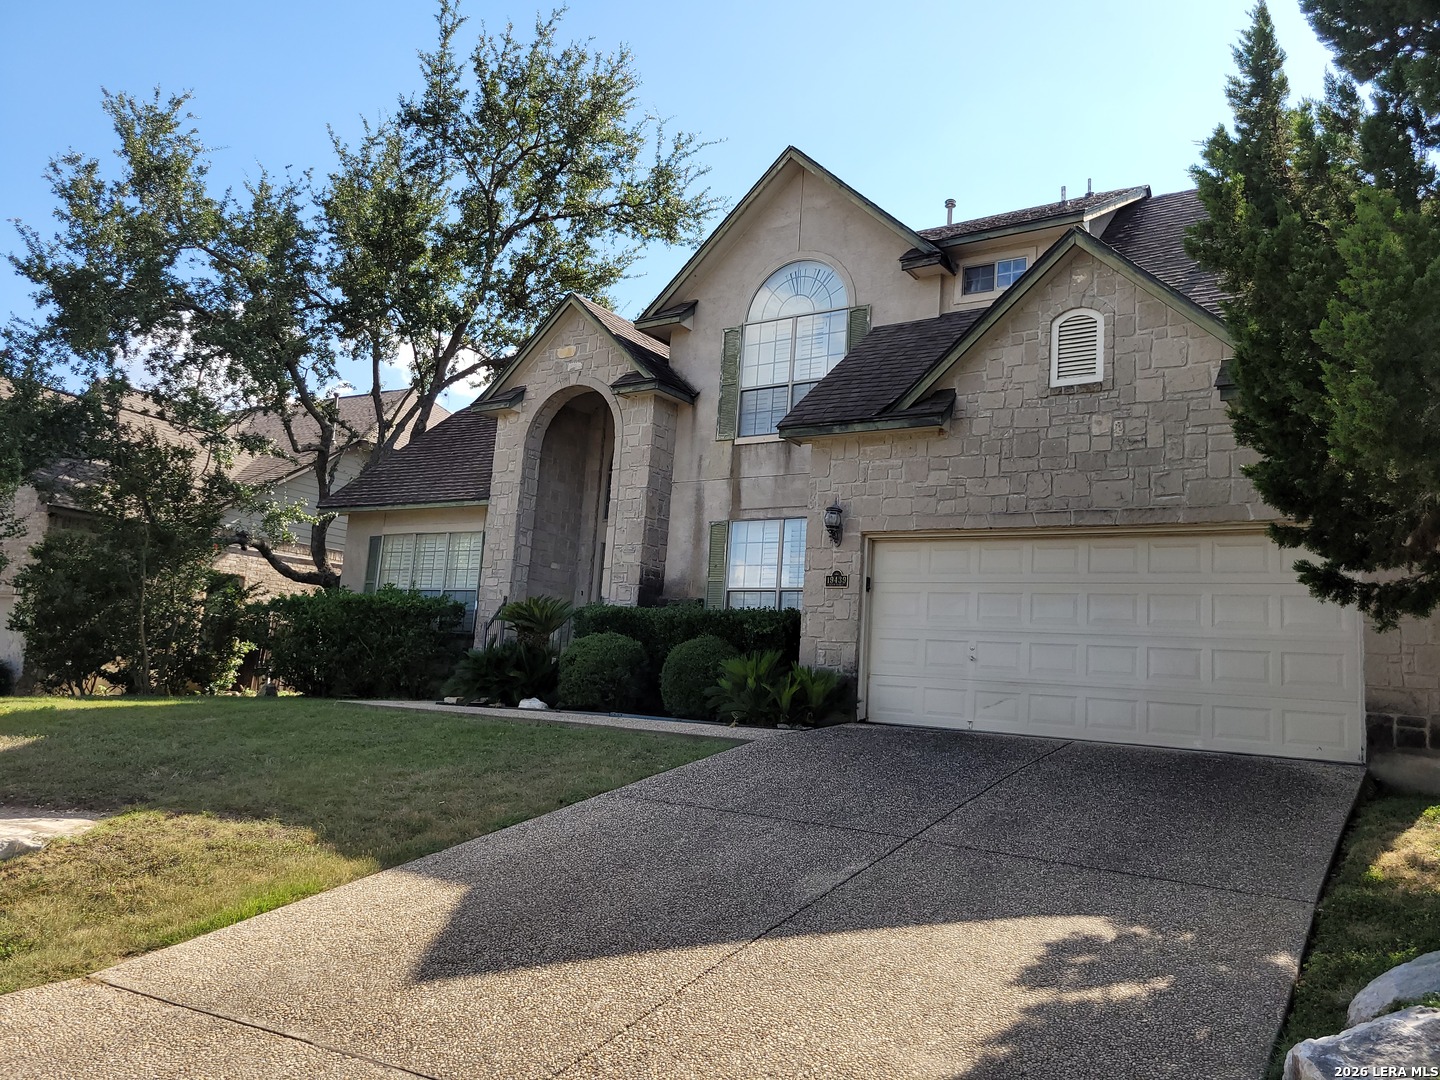

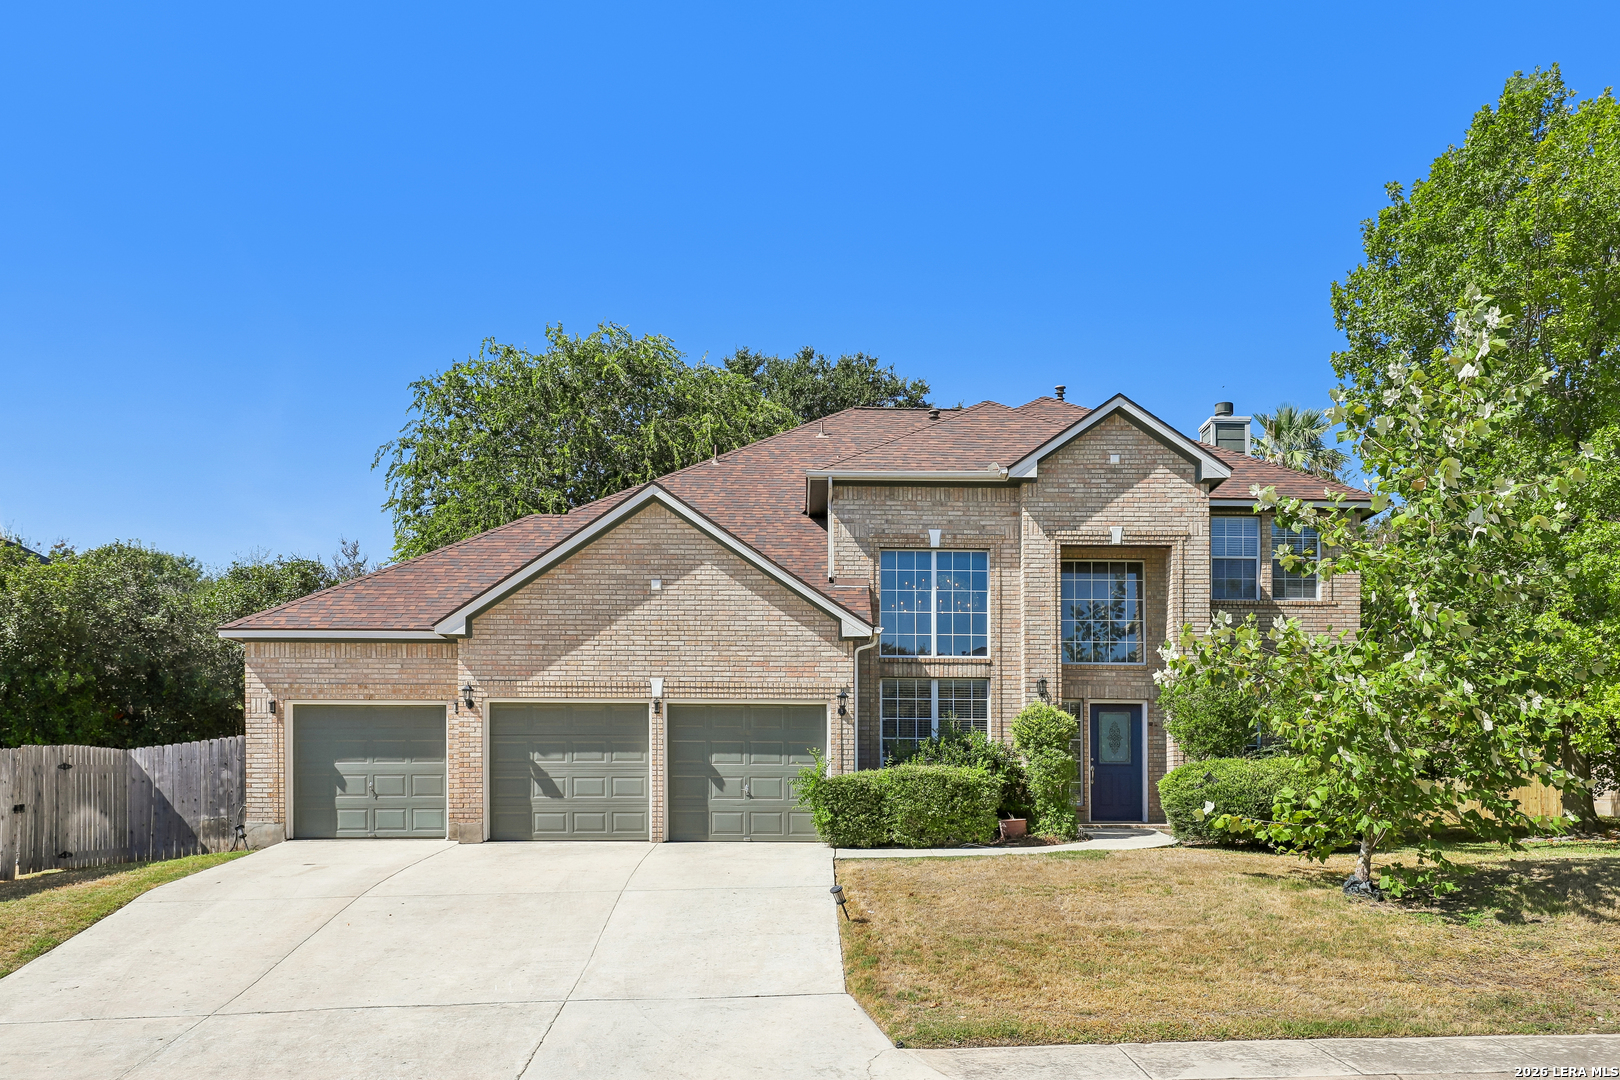
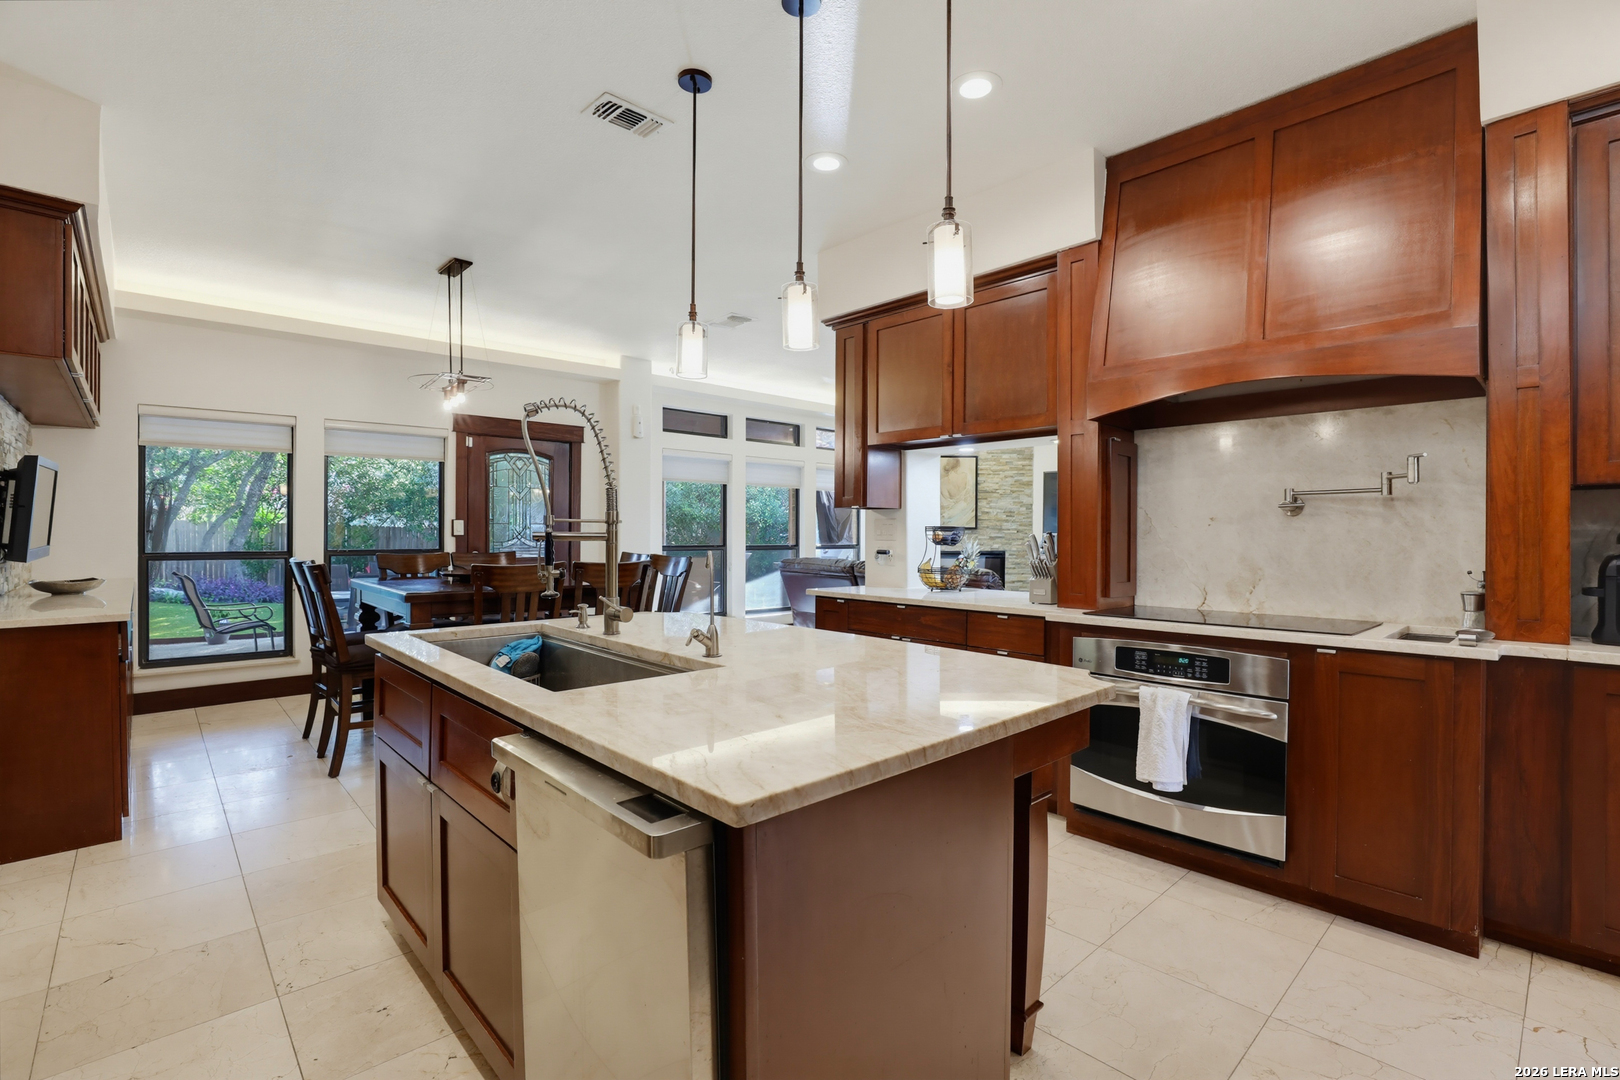
* Values for current month represent month-to-date statistics
The data on this website relating to real estate for sale comes in part from the IDX Program of the LERA MLS.
IDX information is provided exclusively for consumers’ personal, non-commercial use, that it may not be used for any purpose other than to identify prospective properties consumers may be interested in purchasing, and that the data is deemed reliable but is not guaranteed accurate by the MLS. The MLS may, at its discretion, require use of other disclaimers as necessary to protect participants and/or the MLS from liability.
© 2026 LERA MLS.
LERA MLS data last updated on November 06, 2026 01:05 AM - ET.
